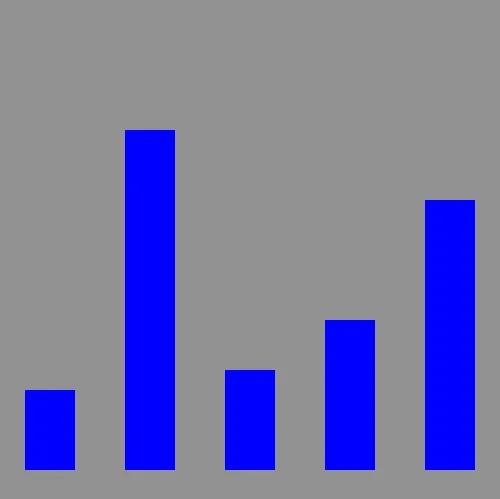
위 페이지에는 캔버스 및 스크립트 요소가 포함되어 있습니다. 캔버스 요소는 콘텐츠가 그려질 실제 화면의 직사각형입니다. 너비와 높이에 따라 크기가 결정됩니다. 캔버스 요소는 DIV와 유사한 블록 수준 DOM 요소이므로 페이지의 다른 요소처럼 스타일을 지정하거나 위치를 지정할 수 있습니다.
스크립트 태그의 데이터 변수는 막대형 차트에서 그릴 데이터 포인트 집합입니다.
이제 캔버스에 대한 참조를 가져오고 배경을 회색으로 채우겠습니다. 데이터 변수 다음에 스크립트 태그에 추가합니다.
//get a reference to the canvas
var canvas = document.getElementById('canvas');
//get a reference to the drawing context
var c = canvas.getContext('2d');
//draw
c.fillStyle = "gray";
// x, y, 너비, 높이
c.fillRect(0,0,500,500);
TypeScript
복사
Add Data
Now you can draw some data. Do this by looping over the data array. For each data point fill in a rectangle with the x determined by the array index and the height determined by the data value.
이제 데이터를 그릴 수 있습니다. 이 작업은 데이터 어레이를 반복하여 수행합니다. 각 데이터 점에 대해 배열 인덱스에 의해 결정되는 x와 데이터 값에 의해 결정되는 높이로 사각형을 채웁니다.
//draw data
c.fillStyle = "blue";
for(var i=0; i<data.length; i++) {
var dp = data[i];
// x : 25 + i*100; y : 30; 너비 : 50, 높이 : dp*5
c.fillRect(25 + i*100, 30, 50, dp*5);
}
TypeScript
복사
Now load this page up in your webbrowser. It should look like this:
SCREENSHOT plain data bars
The first problem is that the bars are coming down from the top instead of the bottom. Remember that the y axis is 0 at the top and increases as you go down. To make the bars come up from the bottom change the y value to be calculated as the height of the canvas (500) minus the height of the bar (dp*5) and then subtract off an extra 30 to make it fit.
첫 번째 문제는 철근들이 바닥이 아닌 위에서 내려오고 있다는 것이다. Y축은 위쪽이 0이고 아래쪽으로 갈수록 증가한다는 것을 기억하세요. 막대가 아래쪽에서 위로 오도록 하려면 캔버스 높이(500)에서 막대 높이(dp*5)를 뺀 다음 30을 빼서 맞춥니다.
//draw data
c.fillStyle = "blue";
for(var i=0; i<data.length; i++) {
var dp = data[i];
// x : 25 + i*100; y : 500-dp*5 - 30; 너비 : 50, 높이 : dp*5
c.fillRect(25 + i*100, 500-dp*5 - 30, 50, dp*5);
}
TypeScript
복사
Now it looks like this:
Axis Lines and Labels
Now add some axis lines by stroking a path starting at the top, down the left side, and across the bottom.
이제 위에서 시작하여 왼쪽 아래로, 그리고 아래를 가로지르는 경로를 사용하여 축 선을 추가합니다.
//draw axis lines
c.fillStyle = "black";
c.lineWidth = 2.0;
c.beginPath();
c.moveTo(30,10);
c.lineTo(30,460);
c.lineTo(490,460);
c.stroke();
TypeScript
복사
Now add the value label and tickmark down the left side.
이제 값 레이블을 추가하고 왼쪽 아래로 체크 표시합니다.
//draw text and vertical lines
c.fillStyle = "black";
for(var i=0; i<6; i++) {
c.fillText((5-i)*20 + "",4, i*80+60);
c.beginPath();
c.moveTo(25,i*80+60);
c.lineTo(30,i*80+60);
c.stroke();
}
TypeScript
복사
And finally add labels across the bottom for the first five months of the year
마지막으로 올해 첫 5개월 동안 하단에 레이블을 추가합니다.
var labels = ["JAN","FEB","MAR","APR","MAY"];
//draw horiz text
for(var i=0; i<5; i++) {
c.fillText(labels[i], 50+ i*100, 475);
}
TypeScript
복사
The result looks like this:
SCREENSHOT chart with axis lines and labels
Not bad but there are a few tweaks we should make. Let's change the background to white so it doesn't seem to dreary, then adjust the position of the bars slightly so they actually start at 0,0.
나쁘진 않지만 몇 가지 수정을 해야 합니다. 어둡지 않게 배경을 흰색으로 바꾼 다음 막대의 위치를 살짝 조절해서 실제로 0.0에서 시작하도록 합시다.
//draw background
c.fillStyle = "white";
c.fillRect(0,0,500,500);
//draw data
c.fillStyle = "blue";
for(var i=0; i<data.length; i++) {
var dp = data[i];
c.fillRect(40 + i*100, 460-dp*5 , 50, dp*5);
}
TypeScript
복사
Now the final chart looks like this:
SCREENSHOT prettier barchart


